The Patent Family Diagram tool is a J2EE tool to discover all members of one or more patent families and their relationships and generate a visio diagram of the family. This ends up saving countless hours relative to when we did this by hand.
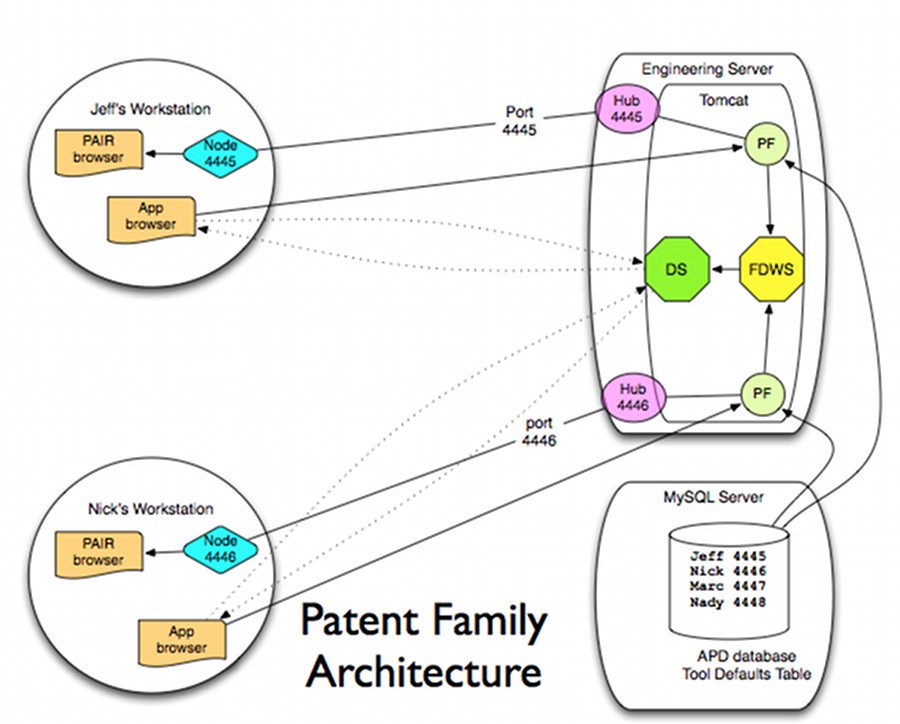
The client didn’t want to subscribe to fee-based data for relationship discovery, so we used Selenium to control a browser on the user’s desktop and gather data from a publicly available web site. This architecture required that each user gets their own port back into the server.
The J2EE program manages the existence of a hub, and the client’s machine runs the Selenium node that knows the address of the hub. The Patent Family (PF) application runs and gathers data about the family, ultimately generating an XML description of the family and sending it to a Family Diagram Web Service (FDWS) over SOAP, which parks a visio diagram of the family on the server. The user’s application web page is notified so that it can present a link which activates a download servlet (DS) to send the visio diagram to the user.
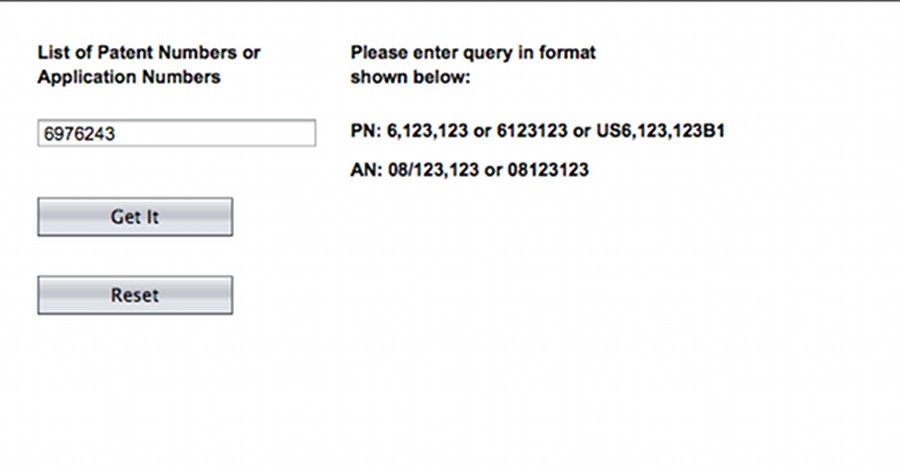
Once the connections are made, the application asks for a set of patents.
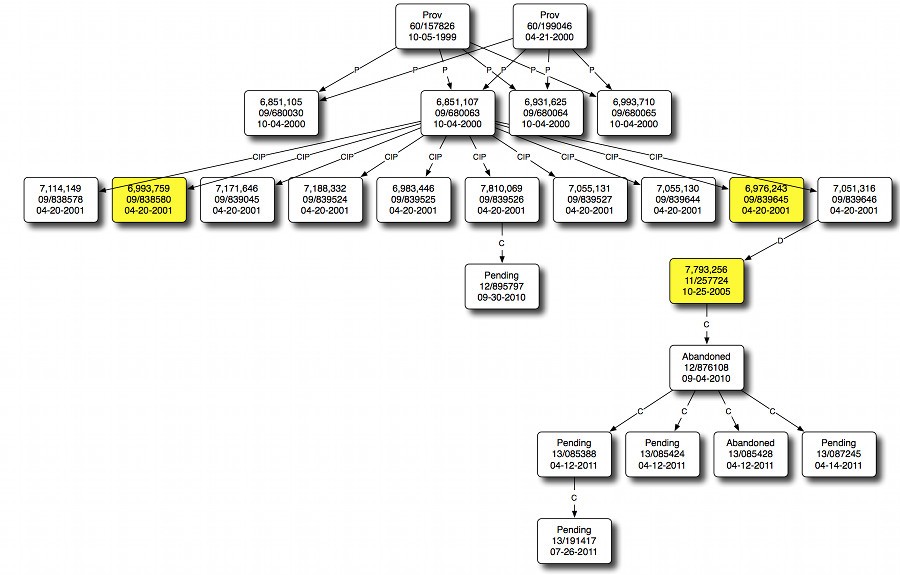
The J2EE application finds all patents above and below a patent of interest. It then recursively explores those starting with the top of the tree so that it can count the number of applications in the family. It visits each application exactly once.
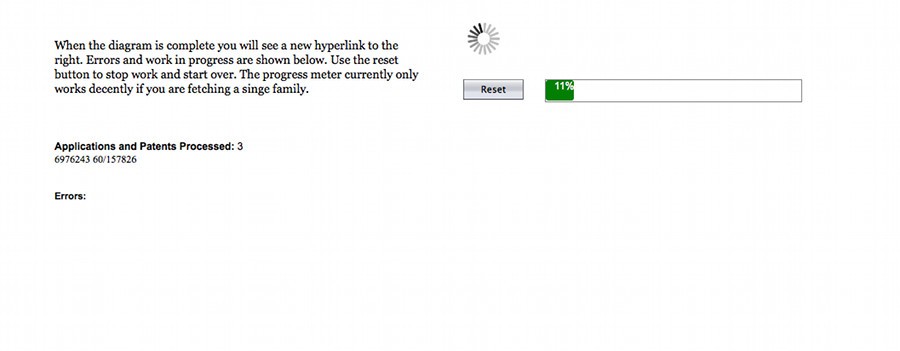
During data gathering, it presents a progress page which is communicating with the server via custom AJAX. The javascript runs off a timer and asks the server for various pieces of information such as how many applications it has reviewed and how many are left, as well as which one were recently visited. It uses that information to manage a progress bar and present a list of applications visited. A publicly available javascript spinner was used to add more dynamism to the page.
When completed, the spinner is replaced with a link to the visio diagram.
The user downloads the diagram and then uses Visio or Omnigraffle to make it look good. Both tools have automatic layout capability which results in excellent diagrams for most families with no additional work. We used colors to communicate patent properties discovered in the process.
Implementation Details
The application has to deal with a number of error cases including the browser dying. To build the diagram generator we had to reverse engineer common visio dagrams in order to determine how to make it attractive. Although the format of the XML of a visio diagram is documented, it is nearly impossible to produce a good looking diagram from the specification.
A careful observer might ask why we had to have the browser session to be analyzed running on the user’s workstation rather than invisibly in the server. The reason is the nature of the data source which requires some interaction with the user.


